Custom Dashboards
Paminga's built-in dashboards answer the questions most teams ask. Custom Dashboards answer yours.
A custom dashboard is a page of cards (we call them dashlets) that you choose and arrange. Each one is a question about your data: open rate this month, form conversions by channel, pipeline created against last quarter, the accounts behind your revenue. Pick a premade dashlet from the library or build one from any dataset. Choose how it's drawn, then size it and place it on a 12-column grid.
You can start from a blank page or from one of the templates below. Either way, you get a page your whole team reads the same way. You can also share it with a public link for people outside Paminga, export it to PDF, or run it from your AI assistant.
Find it under Reporting › Dashboards › Custom Dashboards. The flyout lists your dashboards A–Z, and the + beside the title starts a new one.
Custom Dashboards is in beta and is being rolled out account by account. If you don't see it under Reporting, it isn't on for your account yet.
Start From a Template
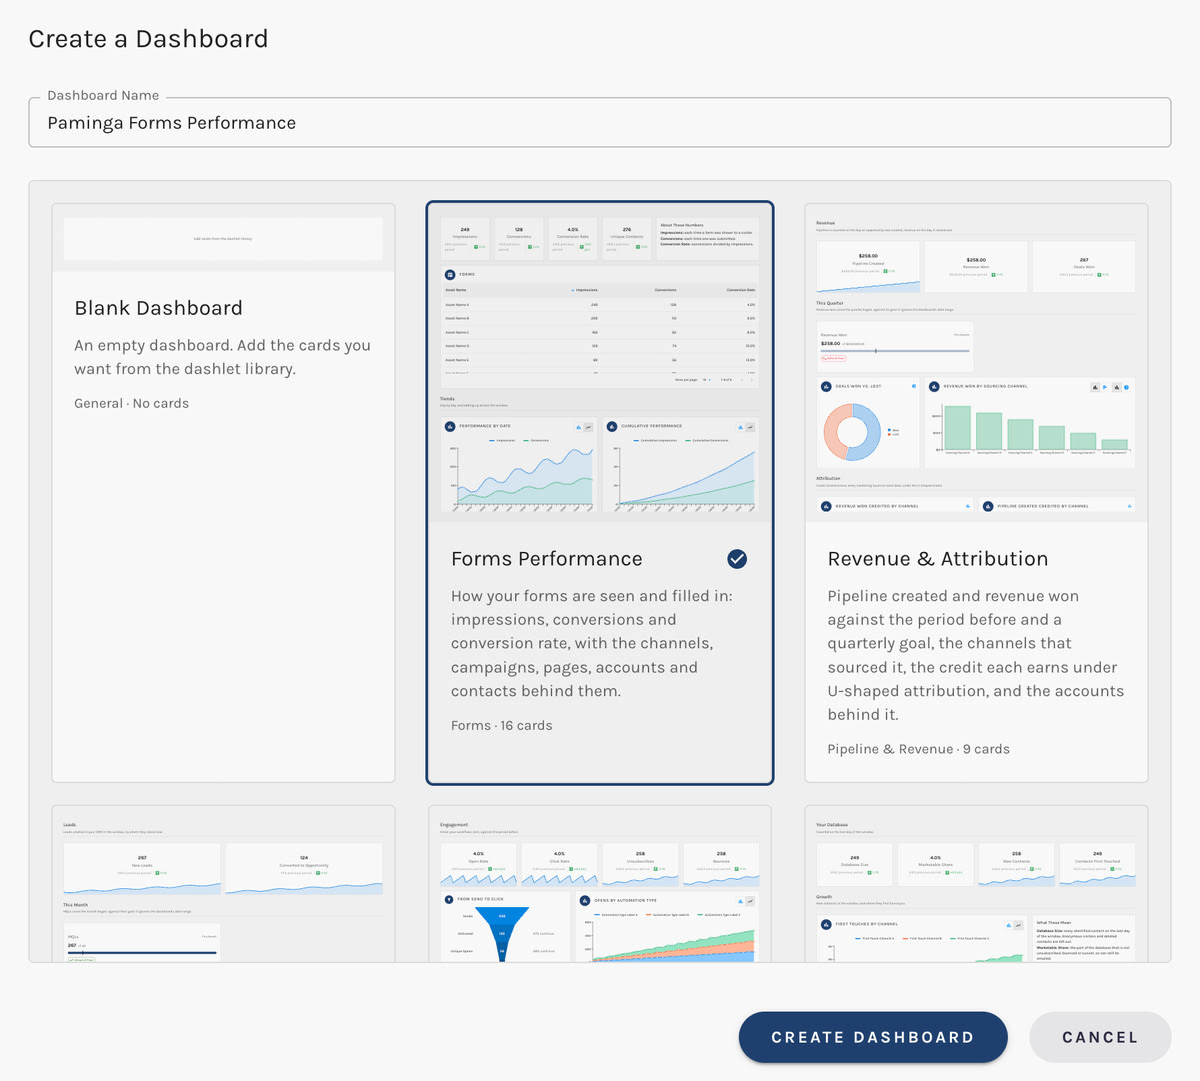
Click New Dashboard, give your dashboard a name, and pick a starting point. Each template card previews the layout with sample data, so you can see what you're getting before you create it.
Create a Dashboard:
| Template | What it shows |
|---|---|
| Forms Performance | Impressions, conversions, and conversion rate, plus the channels, UTM campaigns, pages, accounts, and contacts behind them. |
| Revenue & Attribution | Pipeline created and revenue won against the period before and a quarterly goal, the channels that sourced it, U-shaped attribution credit by channel, and your top accounts by revenue. |
| Pipeline & Leads | New leads and MQLs against a monthly goal, lead-to-opportunity conversion, lead sources, and open pipeline by stage with the largest open opportunities. |
| Email Engagement | Open and click rates, unsubscribes and bounces, a send-to-click funnel, a heatmap of the hours people click, and each email's results. |
| Audience Growth | Database size and marketable share, new contacts and where they first found you, and the contacts you're losing to unsubscribes, bounces, and inactivity. |
| Blank Dashboard | An empty page. Add the dashlets you want from the library. |
A template is a starting point, not a fixed report. Every card on it can be edited, moved, or removed. See Build a Custom Dashboard.
A new dashboard opens in edit mode and stays unsaved until you click Save for the first time. Only you can see an unsaved dashboard, and Paminga deletes it 30 days after it was created. The dashboard tells you the date. Once saved, it stays until someone archives or deletes it.
What You Can Report On
Dashlets draw on the same reporting datasets behind Paminga's dashboards, the Looker Studio connector, and the MCP server. The dashlet library groups them like this:
| Category | Datasets |
|---|---|
| Email Engagement | |
| Forms | Form Submissions, Third-Party Form Submissions, Asset Engagement, File Downloads, Website Visits |
| Leads | Leads, Opportunities, Lead Score Events |
| Contacts | Contacts, Lists, Accounts |
| Automations | Automations, Workflow Activity, Workflow Health |
| CRM Sync | CRM Sync Runs, CRM Sync Errors, CRM Sync Outcomes, CRM Sync Health |
Draw any of them as a number, line, bar, stacked bar, stacked area, pie, funnel, heatmap, goal, or table. One dashlet can offer several of those views and let the viewer switch between them.
What's in the Numbers
Custom Dashboards report on next-gen data: Workflows and forms built in the Form Builder. Email from Classic Campaigns and submissions to Classic forms aren't included.
Data is accurate from May 5, 2026 onward, so the date picker doesn't go back further than that.
Deleted records are left out unless a dashlet filters for them by status. Archived records are included and labelled as archived. Activity on an asset you've since deleted (a deleted form's submissions, for example) still counts. It happened, after all.
Viewing a Dashboard
Date Range
A dashboard opens on its saved date range, such as Last 30 Days or This Quarter. The range is stored as a rule, not as fixed dates, so "Last 30 Days" always means the last 30 days from today. The "Last N Days" ranges end yesterday. The "and Today" ranges and the "This…" ranges include today.
On a live dashboard, use the Date Range picker to look at any other period. Your pick applies to every dashlet on the page and isn't saved, so the next person still sees the dashboard's own range. A compiled dashboard has no picker. It shows its rolling window and when it was last prepared instead.
Dates follow your time zone in Paminga.
Compare to the Previous Period
A Number dashlet can show the figure for the period just before the date range, and the change. Pick the last 30 days and you see the 30 days before that beside it. This is switched on by default for new Number dashlets. It isn't offered on datasets that ignore the date range, such as Accounts, Lists, and Automations.
Drill Into the Data
Click a bar, a slice, a point on a line, a number, or a table row to see the contacts (or opportunities, lists, or sync runs) behind it. The drilldown uses the dashlet's own filters and date range, so the rows add up to the value you clicked. If the list would have to be cut short to load, Paminga tells you instead of showing a partial count.
Managing Your Dashboards
The Custom Dashboards list shows every saved dashboard you have access to, plus your own unsaved ones. You never see someone else's unsaved dashboard. Until it's saved, it's their draft.
| Column | What it shows |
|---|---|
| Name | The dashboard, with its folder path in front if it lives in a folder. |
| Created | When it was created, and by whom. |
| Updated | When it last changed, and by whom. The list is sorted by this, newest first. |
Each row has Archive (or Unarchive) and Delete. Archived dashboards drop out of the Reporting menu. Their public links also stop working.
Who Can Do What
Custom Dashboards permissions are set per role under Dashboards in the Assets category of Permissions.
| Permission | Lets a person |
|---|---|
| Create | Create a dashboard and save it for the first time. |
| Update | Edit and save a dashboard, archive or unarchive it, create public links, and refresh a compiled dashboard. |
| Delete | Delete a dashboard. |
Anyone who can open a dashboard can change its date range, drill into it, and export it to PDF. Dashboards in a folder follow that folder's access: you need access to the folder to open one, and edit access to change it.
Ask Your AI Assistant
If you've connected an AI assistant to Paminga, it can list your saved Custom Dashboards and run one for you, over the dashboard's own range or a different one. Ask "how did our Email Engagement dashboard look last quarter?" and the assistant reads the dashboard your team already agreed on, with the same datasets, fields, and filters, instead of building a similar query of its own. It only reads saved dashboards. It can't edit them.
Keep Reading
- Build a Custom Dashboard: the dashlet library, dashlet settings, layout, saving, and revision history.
- Live and Compiled Dashboards: when to query on open and when to prepare ahead.
- Share and Export Dashboards: public links and PDF exports.