Build a Custom Dashboard
A custom dashboard is built in its own edit mode. Pull in dashlets from a library of premade questions, or build your own from any dataset. Then size them, stack them, and arrange them in rows until the page reads the way you want it to.
Create a Dashboard
- Go to Reporting › Dashboards › Custom Dashboards and click New Dashboard (or the + in the Reporting menu).
- Enter a Dashboard Name.
- Pick a template, or Blank Dashboard to start from nothing. Each card previews its layout with sample data. See Start From a Template.
- Click Create Dashboard.
The dashboard opens in edit mode, ready to change. It stays unsaved, and visible only to you, until you click Save. If it's never saved, it's deleted 30 days after it was created.
To edit a dashboard later, open it and click the pencil (Edit Layout) in its header.
Add Dashlets
Click Add Dashlet on the right to open the library. Search it by name, or narrow it with the category pills: Account, Automations, Contacts, CRM Sync, Email, Forms, and Leads.
Drag a tile onto the grid wherever you want it, or click it to add it as a new row at the bottom.
The Dashlet Library:
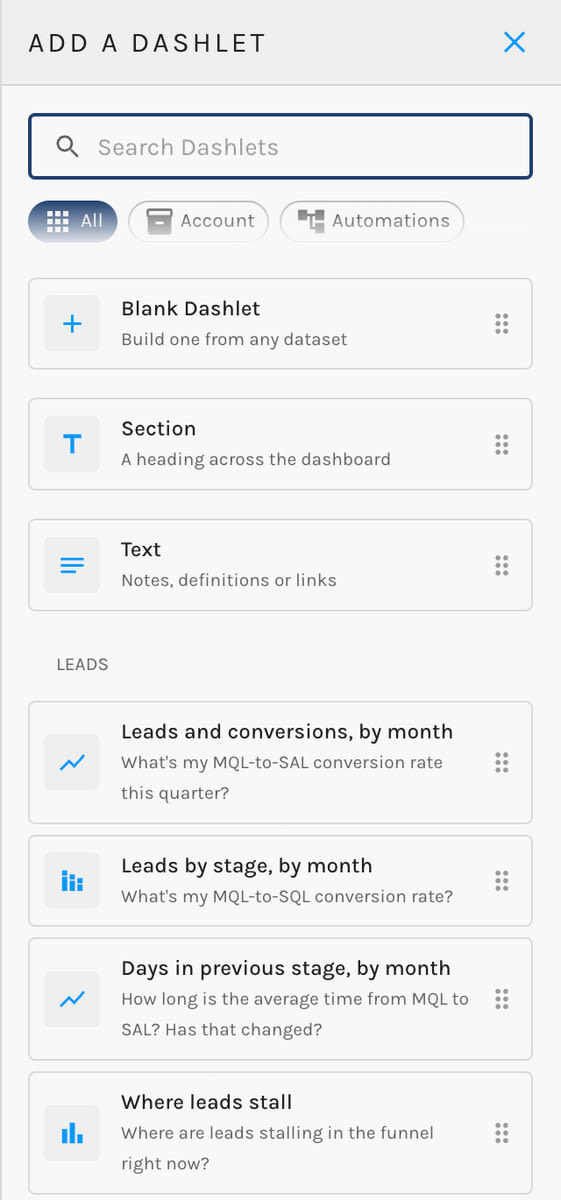
The library holds three kinds of tile:
- Premade dashlets. These are ready-made questions, grouped by dataset, with the measures, groupings, and chart already chosen. Ranked bar and pie dashlets show your top 10. Dashlets about MQLs, SALs, and SQLs only appear if your account has a lead stage of that kind, and they use your own stage names.
- Blank Dashlet. Build a dashlet from any dataset. See Configure a Dashlet.
- Section and Text. A Section is a heading that runs across the dashboard. Use it to break a long page into parts like "Trends" or "Who Converts". A Text card holds notes, definitions, or links. Use it to explain what a number means before someone asks. Neither one queries any data.
To remove a dashlet, drag it back onto the right-hand rail, or click Delete Dashlet in its settings. Nothing is gone for good until you save.
Configure a Dashlet
Click a dashlet (or select it and press E) to open Edit Dashlet. The settings appear in this order. Pick the data first; the measures, groupings, and charts on offer depend on it.
Edit Dashlet:
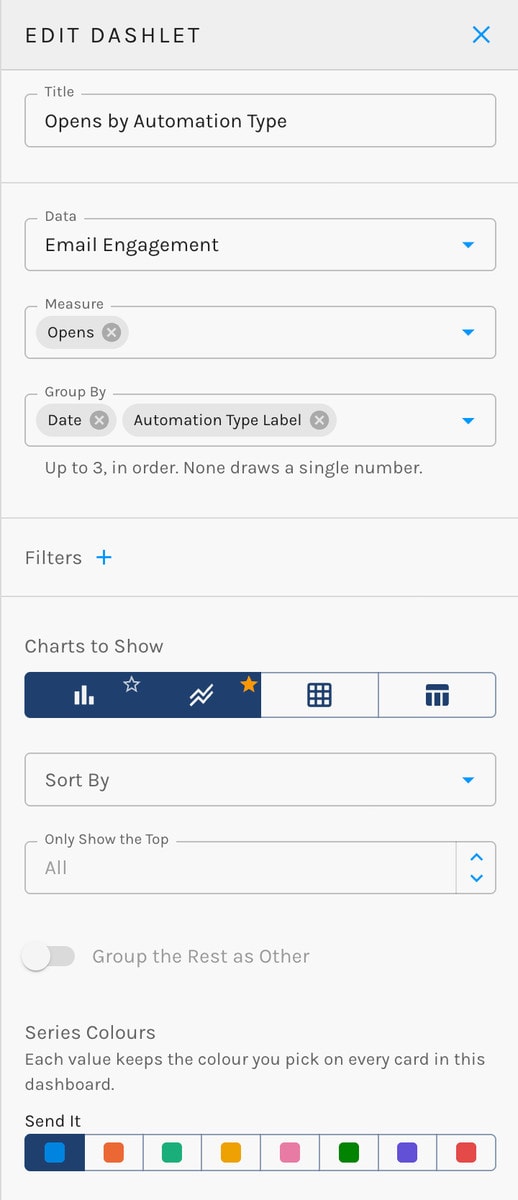
| Setting | What it does |
|---|---|
| Title | The heading on the card. |
| Data | The dataset the dashlet reads, such as Email Engagement or Opportunities. |
| Measure | What you're counting or adding up: opens, conversions, revenue won, and so on. |
| Attribution model | Appears only for measures that credit revenue or pipeline to channels. |
| Group By | Up to three ways to break the measure down, in order, such as by channel and then by month. Leave it empty to draw a single number. |
| Filters | Narrow the data, for example to one automation type or one campaign. Each filter has a field, a condition, and a value. Combine filters with And or Or. |
| Charts to Show | Pick one chart or several. With several, viewers can switch between them, and you choose which one the card opens as. |
Below those, depending on the chart:
- Compare to Previous Period (Number only): shows the period before the date range and the change. On by default.
- Trend Line (Number only): adds a small line of the figure over time.
- Cumulative (Line and Bar): draws a running total instead of each period on its own.
- Stacked or Side by Side (Bar).
- Target and Period (Goal): how much you want, and whether it's for This Month, This Quarter, or This Year.
- Sort By and Only Show the Top: order the rows and keep the top N, up to 500.
- Group the Rest as Other (Bar and Pie): rolls everything past the top few into a single "Other".
- Colour and Series Colours.
A value keeps the same colour on every card on the dashboard. If "Email" is blue in one chart, it's blue in all of them.
Chart Types
| Chart | Best for | Shape of the data |
|---|---|---|
| Number | A headline figure | One measure, no grouping |
| Line | A trend over time | One or more measures over a date |
| Bar | Comparing categories | One grouping and one or more measures, or two groupings and one measure |
| Stacked Bar | Parts of a whole, across categories | Two groupings, one measure |
| Stacked Area | Parts of a whole, over time | A date and a second grouping, one measure |
| Pie | Share of a total | One grouping, up to 8 slices |
| Funnel | Drop-off from step to step | Two to six count measures |
| Heatmap | Where activity concentrates, such as clicks by day and hour | Two groupings, one measure, top 20 on each axis |
| Goal | Progress against a target | One count, for the current month, quarter, or year |
| Table | Detail | Any fields |
Stacked charts and pies show up to 8 series. Anything beyond that is grouped as a grey "Other".
Arrange the Layout
A dashboard is a 12-column grid built from rows.
- Resize a dashlet by dragging its side or bottom edge.
- Stack up to three dashlets in one column, such as a column of headline numbers beside a wide chart.
- Move a row with the grip in the gutter to its left.
- Align a row with the button beside the grip. It cycles through Fill the row, Align left, Centre, and Align right.
You can lay a dashboard out from the keyboard too. Arrow keys move the selected dashlet or row, Shift plus an arrow resizes a dashlet, Esc cancels a move, and E opens the dashlet's settings.
Undo and redo in the top bar go back and forward up to 30 steps.
Dashboard Settings
Hover over the left edge of the editor to open the Settings panel.
Dashboard Settings:
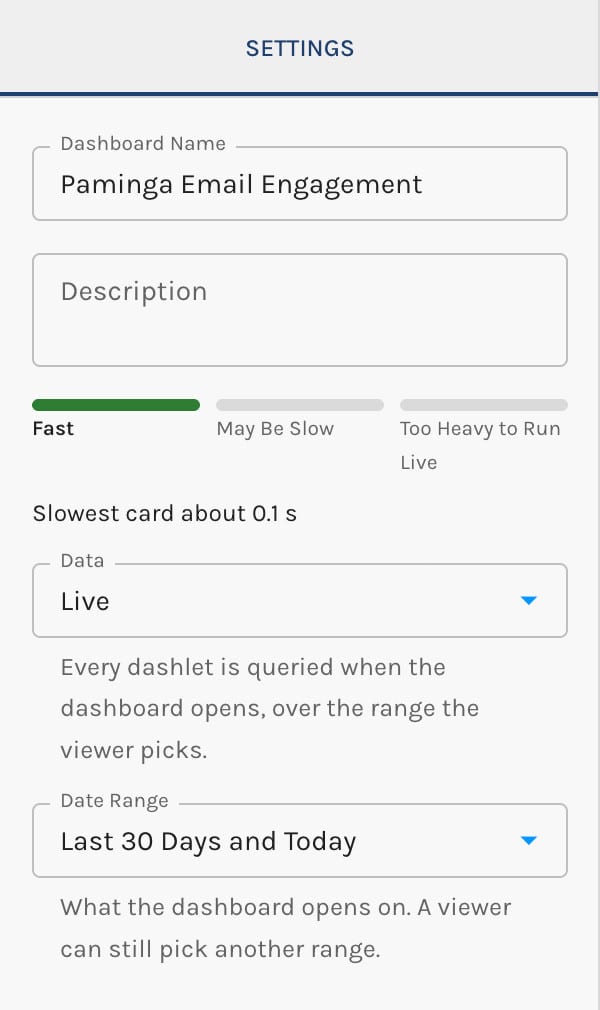
- Dashboard Name and Description.
- Data: Live or Compiled. See Live and Compiled Dashboards.
- Date Range (live): the range the dashboard opens on. Viewers can still pick another one.
- Rolling Window and Time Zone (compiled): the fixed window every viewer sees, and where its days start and end.
Save Your Work
Autosave, in the top bar, is on by default. What it does depends on whether the dashboard has been saved yet:
- Unsaved dashboard. Autosave keeps your draft up to date, but the dashboard stays unsaved (and only visible to you) until you click Save.
- Saved dashboard. Autosave publishes your changes as you go, so the team sees them. Changes you make within a few minutes of each other are kept as one version in the history, rather than dozens.
Turn Autosave off if you'd rather work on a saved dashboard and publish only when you click Save. The setting is yours alone and is remembered in your browser.
A dashboard can't be saved until it has at least one dashlet and every new dashlet has data chosen. A custom date range needs both dates set. If a change makes a live dashboard too heavy to run, Paminga asks you to switch it to compiled or undo the change. See How Heavy Is It?.
If a teammate saves the same dashboard while you're editing it, Paminga warns you instead of letting one of you quietly overwrite the other.
Renaming a dashboard, changing its description, or archiving it saves the dashboard too, along with any draft changes in it.
Revision History
Every save is kept. Click Revision History in the editor's top bar to see each version with its status and who saved it, and when.
- Preview a version to see it as it was.
- Restore as Draft to bring an old version back. It replaces your current draft and doesn't go live until you save it.