Live and Compiled Dashboards
Every custom dashboard runs one of two ways. You choose under Data in the editor's Settings panel, and the choice applies to the whole dashboard.
| Live | Compiled | |
|---|---|---|
| When the numbers are worked out | Each time the dashboard opens | Ahead of time: every night, when it's saved, and on Refresh Now |
| Date range | Viewers can pick any range | A fixed rolling window, with no date picker |
| Opens | As fast as its slowest dashlet | Straight away |
| Best for | Exploring, and dashboards people slice by date | Heavy dashboards, and pages everyone reads the same way |
Live
A live dashboard queries every dashlet when it opens, over the date range the viewer has picked. The numbers are as current as Paminga's data, and anyone can change the range to answer a new question.
Most dashboards should be live. The cost is time: a dashboard with many dashlets over a year of email engagement does a lot of work every time someone opens it.
Compiled
A compiled dashboard is prepared in advance, so it opens at once. Every viewer sees the same numbers, as of the last time it was prepared. The header shows the window and that time, such as "Last 30 Days · as of Nov 3, 6:12 AM", along with the time zone.
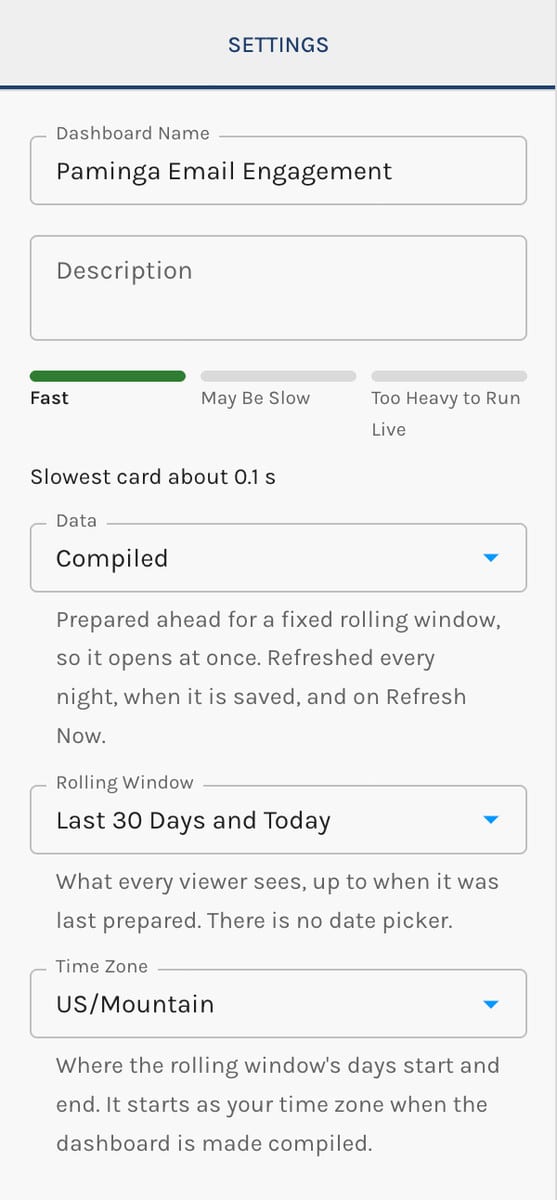
A compiled dashboard needs a Rolling Window, such as Last 30 Days or This Quarter, rather than custom dates. That way each refresh moves the window forward. Its Time Zone decides where the window's days start and end. It starts as your own time zone when you first make the dashboard compiled, and you can change it.
Compiled Dashboard Settings:
When It Refreshes
A compiled dashboard is prepared again:
- Every night, between 1 and 6 AM in its time zone.
- When it's saved. With autosave on, Paminga waits a couple of minutes after your last change, so a burst of edits isn't prepared over and over.
- When you switch it to compiled or change its rolling window or time zone.
- When someone clicks Refresh Now in its header. That needs the Update permission, and it can be used once an hour per dashboard.
A dashboard that has never been saved isn't prepared until its first save.
Status Messages
| You see | What it means |
|---|---|
| Preparing this dashboard. Ready in about N min. | The first preparation is running. The banner counts the dashlets done. |
| Updating with recent changes | A refresh is running. You're looking at the previous numbers until it finishes. |
| Data as of time · update failed | The latest refresh failed. You're seeing the last good numbers, from the time shown. |
| This dashboard couldn't be prepared. | It has never been prepared successfully. Try Refresh Now. |
A dashlet with too much data to prepare (more than 200,000 rows) shows an error on its own card. The rest of the dashboard is unaffected. Narrow that dashlet with a filter, a shorter window, or less grouping.
How Heavy Is It?
In the editor's Settings panel, a meter above Data estimates how long the dashboard would take to open live: Fast, May Be Slow, or Too Heavy to Run Live, with the slowest dashlet's time beside it.
The estimate is based on how long the same kinds of dashlet actually take in your account. Where there's no history yet, Paminga shows a rough guess but won't hold you back on it.
If a change makes the dashboard too heavy to run live, Paminga stops you and names the dashlet responsible. It may suggest a shorter window, less grouping, or turning a comparison off. You can also Undo This Change or Switch to Compiled. For the same reason, a compiled dashboard that's too heavy can't be switched back to live.
If a live dashboard turns out to be slow in practice (over the last week, not just as estimated), editors see a notice offering to switch it to compiled.