The Data Your Programs Actually Need
Reporting in Paminga is built into the platform — not bolted on. Every asset, every workflow, every drip series, and every CTA comes with reporting automatically.
No dashboards to build. No reports to save. Period-over-period comparison, flexible date ranges, drill-down to individual records, and chart formats you can toggle on the fly — all available from the moment you create anything in Paminga.
Always On. Never Configured.
Reporting that comes with the platform — not on top of it.
Most reporting tools require you to build something before you can see anything. Paminga works differently. Every asset and campaign you create automatically has reporting associated with it. Right-click a folder in the finder or drill into any asset — the data is there. No report builder, no setup, no waiting.
4
Top-Level Metrics
Unique impressions, unique conversions, conversion rate, and unique contacts — always visible at the top of every dashboard.
Any
Date Range Flexibility
All time, yesterday, last 7 days, last 30 days, or fully custom. Apply once — every tile on the dashboard responds.
+/−
Period-Over-Period
Every metric shows change vs. the prior period — so you know at a glance whether things are moving in the right direction.
List
Drill to Records
Every dashboard tile is clickable. See the individual contacts behind any data point — not just the aggregate.
Workspace & Asset Reporting
From folder-level overview to individual asset performance.
Workspace reporting gives you a top-down view of performance across all assets in a folder — impressions, conversions, CVR, top channel, and top source — with the ability to drill into any individual asset. Asset-level reporting gives you the same depth, scoped to a single email, form, landing page, or CTA.
Every chart, multiple formats.
Performance by date in bar, line, or pie. Cumulative impressions and conversions in a persistent line chart. Top marketing channels, top marketing sources, UTM campaign, UTM source, and UTM medium — each sortable by impressions, conversions, or CVR, and toggleable between bar and pie chart.
Top accounts and top contacts give you the same flexibility — sort by any metric, view in the format that makes the most sense for what you're trying to see.
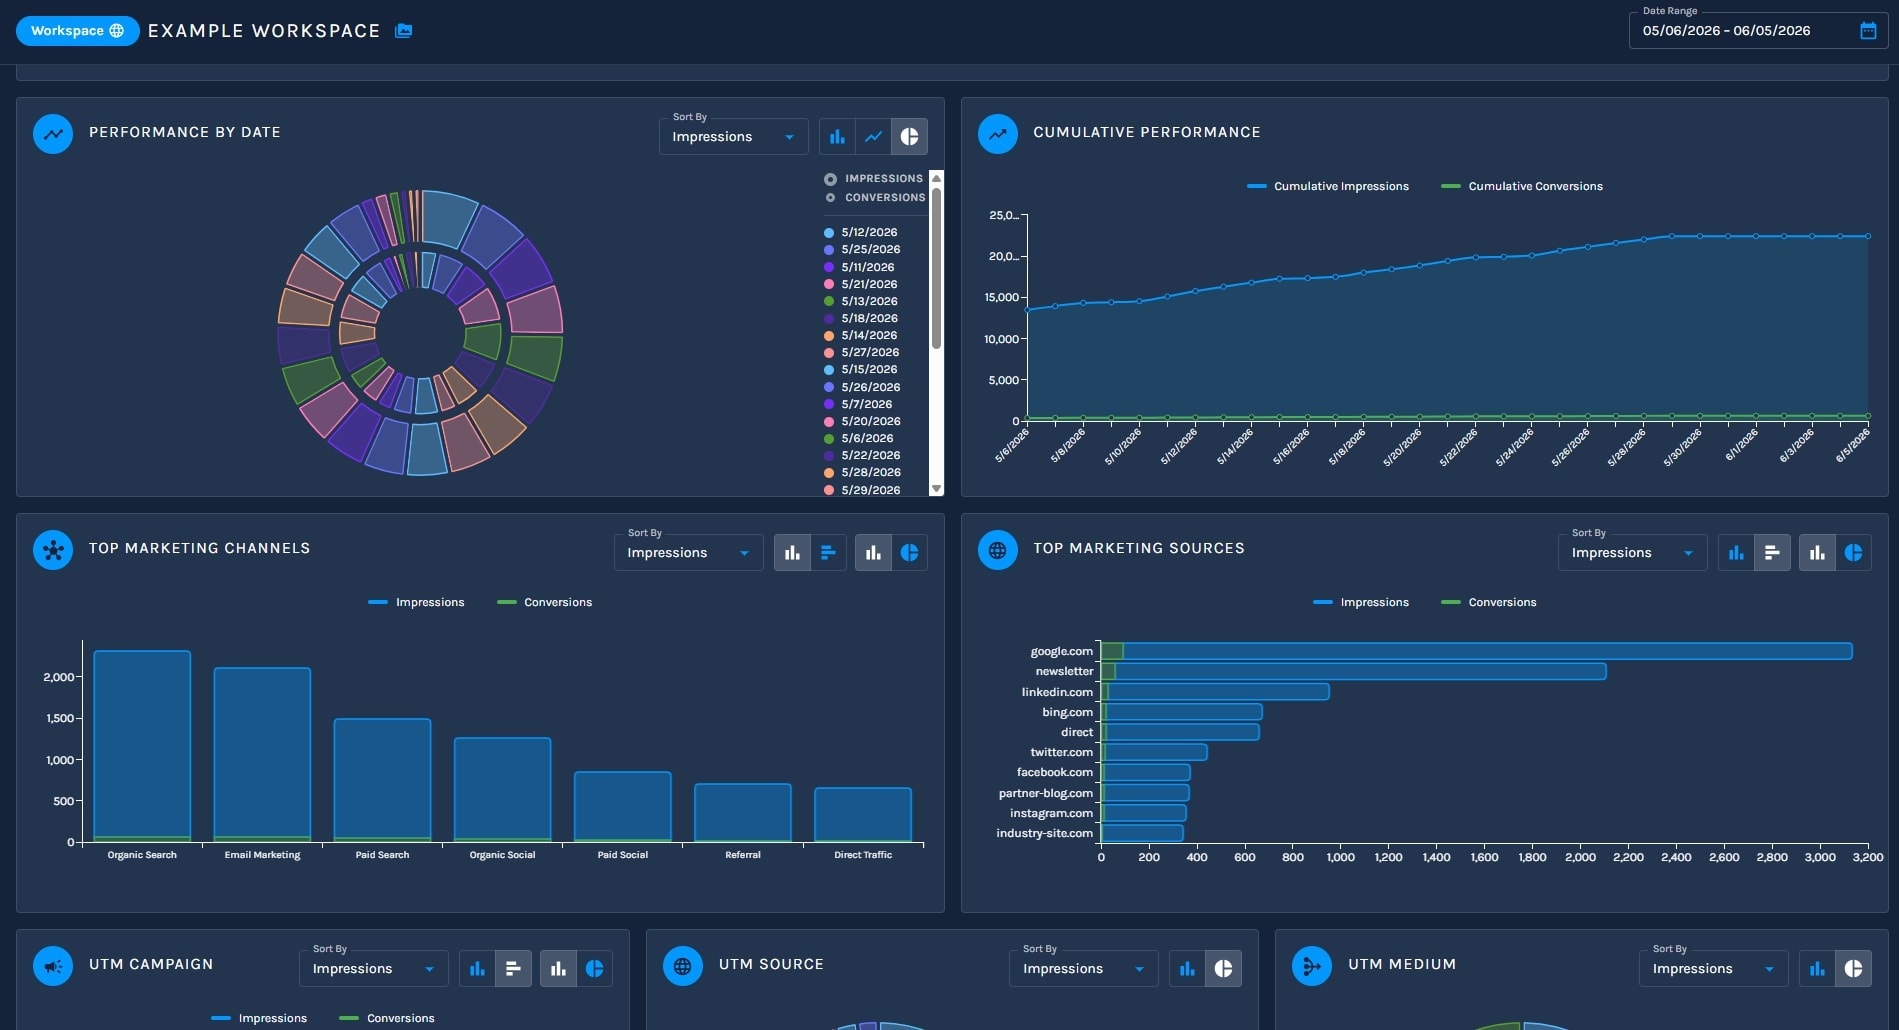
Reporting is available at both the workspace level and the individual asset level. Access it by right-clicking any folder in the finder, or by drilling into a specific asset. Nothing to configure. It's just there.
What Every Dashboard Includes
Consistent reporting logic. Across every channel.
Whether you're looking at a workflow, a drip series, or a standalone CTA, the reporting structure is consistent — so once you know how to read one dashboard, you know how to read all of them.
Summary Metric Tiles
Unique impressions, unique conversions, conversion rate, and unique contacts — displayed at the top of every dashboard with period-over-period change. You see total count, the metric label, and whether you're up or down vs. the prior period.
Performance by Date
Impressions and conversions over your selected date range — viewable as a bar chart, line chart, or pie chart. Cumulative performance (total impressions and conversions over time) is shown as a persistent line chart alongside it.
Top Marketing Channels & Sources
See which channels and sources are driving impressions and conversions. Sort by impressions, conversions, or CVR percentage. Toggle between vertical bar, horizontal bar, and pie chart. Hover any data point to see exact values.
UTM Campaign, Source & Medium
Three dedicated tiles — one per UTM parameter — each sortable by impressions, conversions, or CVR. See exactly which campaigns, sources, and mediums are driving performance. Bar chart or pie chart, your choice.
Top Accounts & Top Contacts
See which accounts and contacts are engaging most — sortable by impressions or conversions, viewable as a bar chart or pie chart. Click any bar or slice to see the underlying records.
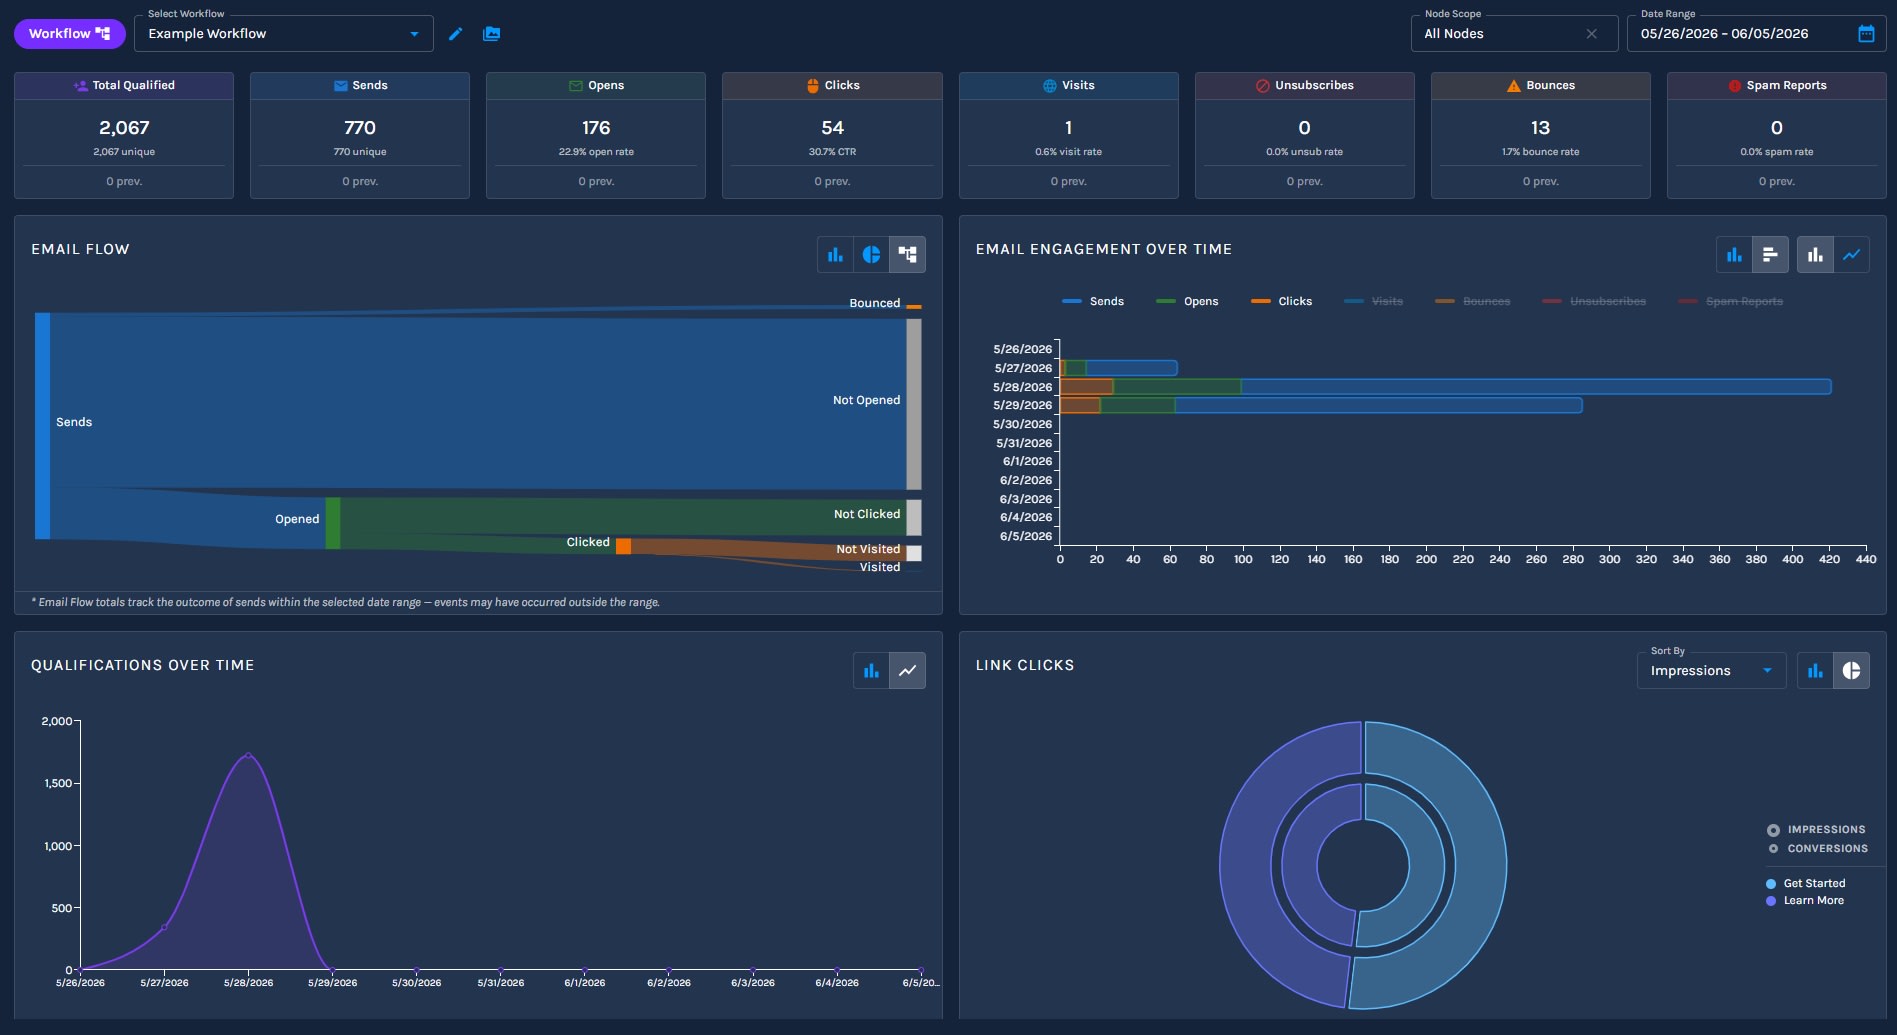
Workflow Reporting
See exactly how contacts move through every journey.
The Workflow Dashboard gives you a complete view of how your automation programs are performing — across all workflows, or scoped to a specific one. Select any workflow from the dropdown and the entire dashboard responds to it.
Eight performance metrics. One dashboard.
Total qualified, sends, opens, clicks, web visits, unsubscribes, bounces, and spam reports — all with period-over-period change, all responsive to the date range you've set. The workflow breakdown table groups all your workflows by status and shows the same metrics side-by-side.
Drill into any workflow and every tile updates — email flow, engagement over time, qualifications over time, and link clicks all scope to that specific program.
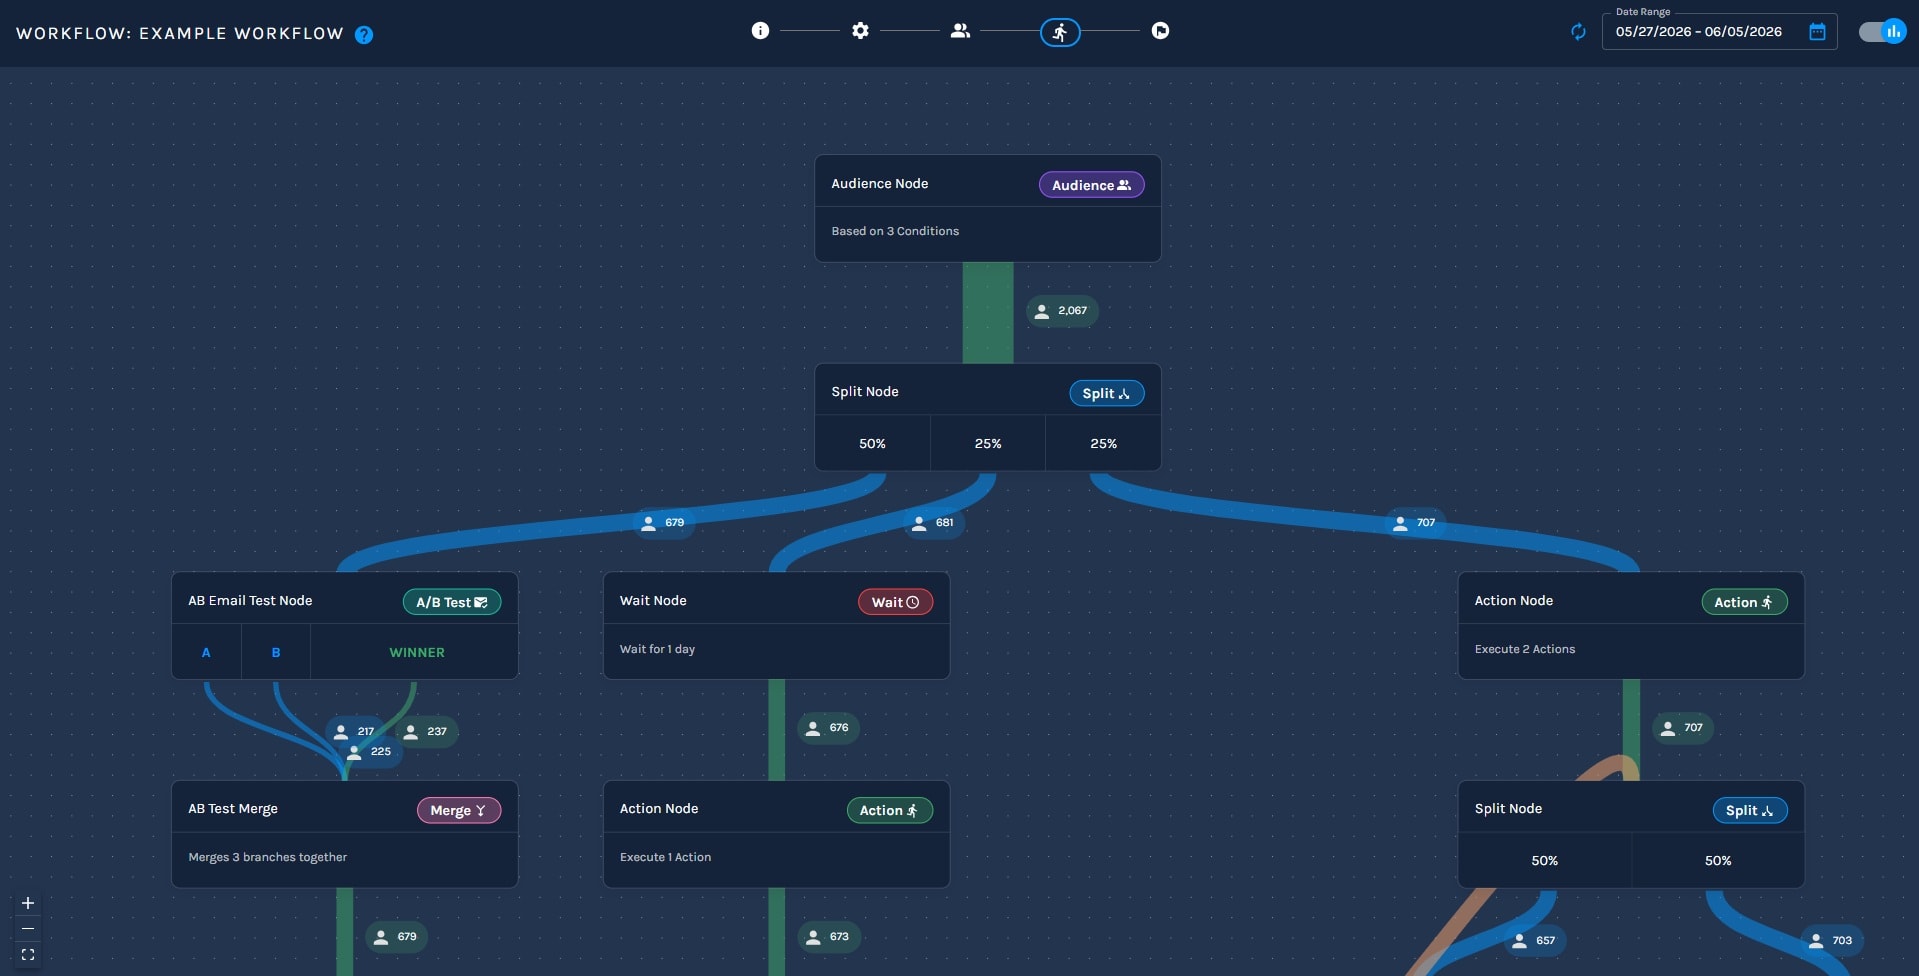
Stats mode: contact counts at every node.
Toggle into stats mode on any running workflow and see how many contacts have passed through each node — audience size, split percentages, A/B test distribution, and branch outcomes — all overlaid on the live canvas without leaving the builder.
It's the fastest way to understand what your automation is actually doing in real time.
Email Flow (Sankey Chart)
Visualize how many contacts were sent, who opened and converted, who opened and didn't, who didn't open at all, and who unsubscribed — in a single flow diagram. Also available as bar or pie chart.
Email Engagement Over Time
Sends, opens, and clicks plotted over your date range. Bar chart or line chart. See exactly when engagement peaks and when it drops off.
Link Clicks
Total clicks and unique clicks broken down by link — so you know which CTAs inside your emails are actually driving action. Bar chart, horizontal bar, or pie.
Qualifications Over Time
Track how contacts enter and progress through the workflow over your selected date range. Bar chart or cumulative line chart.
Node-Level Stats View
Toggle into stats mode on any live workflow and see contact counts at every node — how many qualified, how many are in progress at each step, how many have exited each branch.
Workflow Breakdown Table
All workflows listed in one table — grouped by status, with qualified, sends, opens, clicks, visits, bounces, unsubscribes, and spam reports side-by-side. Click any row to drill in.
Drip Series & CTA Reporting
Email-by-email performance. CTA-by-CTA clarity.
Use the same reporting logic across drip series and CTAs, with views that stay specific to the asset you are evaluating.
Drip Performance Report
Email-by-email breakdowns.
The Drip Series Performance Report breaks down each email in your sequence individually — qualified, sent, opens, clicks, visits, bounces, unsubscribes, and spam reports for Email 1, Email 2, Email 3, and so on.
View all time by default, or scope the report to a date range.
Drip Dashboard
Aggregate views by drip series.
The Drip Series Dashboard gives you the same aggregate view as the Workflow Dashboard — scoped to all drip series, or a specific one you select from the dropdown.
Same metric tiles, same chart tiles, same period-over-period comparisons.
CTA Dashboard
See what's converting.
The CTA Dashboard shows impressions, conversions, CVR, top channel, and top source across all your CTAs — with an asset breakdown table that lets you compare them side-by-side.
Select a specific CTA and the dashboard scopes to it, giving you the same full reporting suite for that individual asset.
Record Drilldown
Every number can become a list.
Every metric tile shows period-over-period change. Every chart tile is clickable to see the underlying contact records.
Every chart format is yours to toggle, so the same data can be read in the format that fits the question.
No Setup. No Saving. No Waiting.
Reporting that works the way reporting should.
Every asset comes with reporting automatically. Right-click a folder, drill into an asset — the data is already there. No report builder. No configuration required.
Period-over-period on every metric. Not just the total — whether you're up or down vs. the prior period, always visible, always current.
Drill to individual records from any data point. Every tile is clickable. The number in a chart isn't just a number — it's a list of contacts you can act on.
Consistent reporting structure across every channel. Workflows, drip series, CTAs, and workspace-level reporting all follow the same logic — learn it once, read it everywhere.
Chart formats you control. Bar, horizontal bar, line, pie, Sankey — toggle on the fly without leaving the dashboard or rebuilding anything.
See It in Action
See how Paminga's reporting works across every asset type — in a live platform walkthrough.
Built with pride in Denver, Colorado, USA
Copyright © Paminga, Inc. 2026All rights reserved. Various trademarks held by their respective owners.